How are you doing?
And how is your website doing?
Has your latest redesign been successful?
Are you achieving your goals?
Every website and website-owner has goals. If you are a consultant you want to get clients to drop you a line. If you are running a service, you probably want visitors to become paying clients and existing clients to find everything they want on your website. If you are writing a blog you want people reading your posts and subscribing to your blog.
“How is your website doing?” is a simple question to ask, but can be difficult to answer. In this post we’ll take a look at this question from a few angles. Afterwards, just let it sink in and schedule an hour for yourself to answer this question for your own website.
Tip 1: Set your goals
Starting point: what are your goals? If you cannot answer this question right away, then schedule some time in your agenda to think this over. You can start at the abstract level (“getting clients”) and go into more detail (“getting clients to fill out the contact form”). Or in case of a blog (“getting visitors”) and in detail (“getting visitors who read my articles”).
You don’t have to get this perfect right away; the important thing is to get started.
Tip 2: Beware of vanity metrics
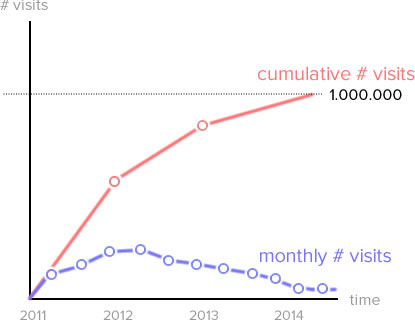
“Our website is doing great! We just received our millionth visit!”
This sounds good and can be an indication of success. However, there could be a downward trend going on that may paint a less successful picture of the situation.

In this case it is more useful to look at the monthly number of visits and compare it to last month or last year (to avoid seasonal changes). If your monthly number of visits goes up you must be doing something right, right? Right! But there is more to be discovered in the details.
Now we can get to the magic of adding an extra metric to the monthly visits, for example the average time on site.
Tip 3: Combining metrics in pairs
“A lot of visitors are not necessarily an indication of success for your website if they bounce right away.”
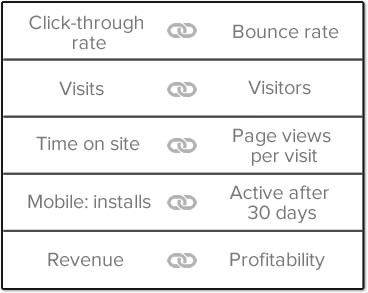
Avinash Kaushik (digital marketing evangelist for Google) has a great post about combining metrics. The idea is to make pairs of metrics that will show you the bigger picture. So, in the example of monthly visits, it is useful to combine this with monthly visitors. This will tell not only how many you are able to pull in, but also how many come back (which is often a sign that you are offering something useful on your website).
Imagine how much better it is to not just know the left column but to also know it in relation with the other number.

Another great example from mr. Kaushik is the combination of Time on Site + Page Views per Visit. Compare the insight you get from these 2 chunks of information:
Single Metric chunk of information
- Week 1: average time on site = 50 seconds
- Week 2: average time on site = 140 seconds
- Week 3: average time on site = 75 seconds
It looks like you may have done something in the second week that was helpful to your website, right? Big increase in average time on site, after all!
Double Metric chunk of information
- Week 1: avg time on site = 50 seconds + 4 page views per visit
- Week 2: avg time on site = 140 seconds + 20 page views per visit
- Week 3: avg time on site = 75 seconds + 5 page views per visit
Now, it all looks different! Week 2 (for whatever reason in this imaginary case) seemed to have visitors jump around your website without hardly spending any time on each page! That cannot be good. Now you should dive into the context to see what happened.
Tip 4: Remember the context
“A high bounce rate may be a good thing…”
Now, there is context. A website like Wikipedia may actually have a high bounce rate, because of the context in which people visit Wikipedia. A large part of their visitors is probably looking for the answer to one specific question that they have. Is it bad that people find what they want and then leave? In Wikipedia’s case a high bounce rate isn’t necessarily a bad thing. At the same time they probably see a large number of visitors spending over an hour caught up in all their wonderful content.
A high average time on site and a high amount of returning-visitors may look great, but it depends on the type of website you are running. If it’s a marketing-blog with some articles, it is great. But if it is a support page on how to install your brand’s WiFi-Router, then you would probably hope that visitors don’t have to spend much time on your website. And if they do, you don’t want them returning to the same pages several times in the next week…
Tip 5: Measure both macro and micro conversions
“There is more than just macro conversions (such as “purchase completed”). Micro-conversions can bring additional success in the long run.”
Now, let’s take a step back and instead of looking at your analytics data, take a look at your website. What is the main thing you would like your visitors to do? Is it to complete an order in your webshop? Then the thing you would want to measure is how many visitors reach the “you’ve completed your order-page”. This is what people at the Google analytics team call a macro-conversion. It’s macro because something big is achieved. This doesn’t mean that everything else your visitors do, is worthless.
The smaller, but still valuable actions, are called micro-conversions. Visitors can subscribe to your mailing-list, watch content, read articles, like a post, share your website, download an e-book, etc. These micro-conversions create a bond between you and your visitors. It may not directly earn you money, but in the long run some of these mailing-list subscribers may turn into buyers. Measuring your micro-conversions and acknowledging the part they play in your revenue, can help you to implement them better on your website. For example, ask people to subscribe first and try to convert them later.
A lot of customers like to have a look first and may buy during their second or third visit, sometimes weeks later, may be on a different channel. This is called multi-channel conversion.
Need help setting your goals? Send us an email
Tip 6: Be aware of multi-channel conversions
“Many visitors require several visits before they convert.”
How often have you browsed Amazon.com or Ebay without buying anything? You probably more often visit an e-commerce website without buying anything than actually making a purchase on the spot. This phenomenon is called “multi-channel conversion” and it is important when you want to decide which marketing efforts are useful and which ones are useless.
If you are running an Adwords campaign on Google, you may notice that your display-campaigns are less effective in converting visitors into customers, as compared to a search-campaign. This is mostly because a search-campaign targets someone who is actively searching for an answer (to which your business may offer the solution). A display campaign on the other hand is targeting people who are browsing websites on the internet without a specific need on top of their mind.
Some visitors coming in through your display campaign are more likely to just browse for information on your site, then to convert directly. Their first contact (first step in the multi-channel) is however helpful in creating brand-awareness. Now they may return a second or third time to your website and finally convert into a paying customer.
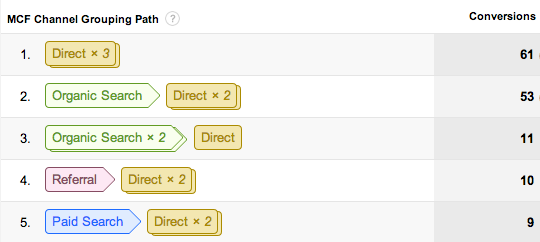
Google analytics has a multi-channel report where you can see the various multi-channel conversions.

Here you see the separate visits that a visitor went through before they converted. The first group (Direct x 3) consists of visitors who required three direct visits before they finally converted. The second group (Organic Search > Direct x2) found the website first doing a search and then came back twice before they finally converted on their third visit.
A classic mistake is to look only at the type of visit that actually converted the visitor. This is the last step of the conversion, in the image above always a “direct visit” (the one to the right is the last one). However, the previous interactions obviously contributed to the final visit that converted. So the Paid search in the fifth group isn’t wasted because the visitors did not convert directly. The paid search brought 9 visitors to our website, that each took two more visits and then they did convert. Success!
Tip 7: Beyond the metrics. Talk to visitors
Google analytics can reveal where you are losing visitors, a user test can tell you why you are losing visitors.
You can count your visitors in Google analytics. You can observe their behaviour. Track their interactions on your website. How can you ask them?
What is a better indication on your website’s success than happy customers giving you feedback that they are, well, happy! (Of course you still need your revenue) Figuring out how people feel and think about your website is obviously insightful. One way to do this is by performing user tests. We do a lot of user testing at UNITiD. You can read more about our method nano testing here.
If you are new to user testing, go and watch this youtube video of His Royal Highness of user testing, Steve Krug. You can see that sometimes sitting next to a user and hearing him speak out his thoughts often creates a better understanding than staring at your Google analytics numbers. Google analytics can reveal where you are losing visitors, a user test can tell you why you are losing visitors.
There are also some remote user testing tools available:
or if you want to just test an idea or prototype you can use Proved.
These services allow you to invite users to test your website on their computer, from a comfort of their homes. It is easy, fast and is relatively cheap. The downside is that you are not actually with the user in the room and cannot communicate with them directly, making it somewhat less valuable than sitting side-by-side during a user test.
Other ways you can get feedback from your visitors is with the help of chat-with-your-customers-tools like Qualaroo, Uservoice, Olark.
Need some help with user testing? Send us an email
Tip 8: The Net Promotor Score (NPS)
Then there is something called the Net Promotor Score. A single question you can ask all your users (who have actually really used your product):
How likely is it that you would recommend our company/product/service to a friend or colleague?
The idea is that you ask people to respond on a scale of 0-10. Everyone who gives a score between 0-6 is an unhappy customer / detractor, 7-8 is ignored, 9-10 is a happy customer / promotor.
An NPS with more promotors than detractors is considered a good score. It obviously gives you a benchmark / starting point to listen to the feedback and improve your score.
Tip 9: Schedule (at least) one hour a week to check your metrics.
Too often we rush through our weeks without a moment to pause and think about how we are doing. Stuff on the to-do lists may seem important, but running in the wrong direction is both a waste of time as a waste of energy. Spending one hour a week to look at your “success-compass” makes your next week’s run more effective.


